Graphical Visualization Solutions
for the Oil & Gas Industry

Construct a full-chain three-dimensional digital twin that integrates geological models, real-time data, and geographic information, achieving comprehensive and transparent oversight from underground reservoirs to surface facilities. It provides an intuitive and reliable global perspective for exploration and development optimization, production monitoring, and collaborative decision-making.

Limitations of Traditional Graphical Visualization

Lack of Visual Standardization

Inconsistent graphical output hinders intuitive interpretation and accurate analysis of data.

Weak Link Between Data and Visuals

Visuals are often disconnected from backend data resources, preventing timely updates and diminishing the value of outdated information.

Poor Interactivity & Static Experience

Most solutions offer only basic display capabilities, lacking interactive tools for in-depth exploration or detailed drill-down analysis.

High Barriers with Professional Tools

Heavy reliance on complex desktop software results in long learning cycles, requiring significant time for manual plotting work and diverting efforts from critical research and decision-making.

Restricted Scope of Web-Based Solutions

Although web-based visualization offers improved efficiency, current applications in this domain remain limited, often supporting only basic chart types such as simple bores and statistics, which fail to meet the needs of sophisticated operational scenarios.

Oilfield Graphical Visualization Solution

Unified Data Foundation, Breaking Down Information Silos

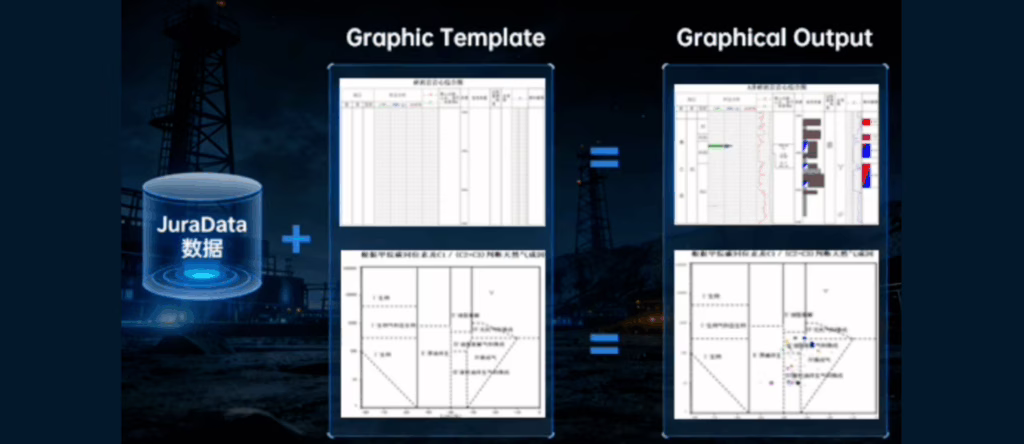
Driven by the independently innovated JuraData integrated data lake platform as the core foundation, GeoMapX fundamentally addresses the challenge of integrating multi-source, heterogeneous data. All graphical visualization applications are built upon this single, authoritative, and cleansed data source, ensuring “one truth, one source” from the ground up. This establishes a reliable data cornerstone for all subsequent intelligent applications.

AI-Powered, One-Click Visualization

GeoMapX enables users to select “Professional Chart Templates + Real-Time Oilfield Data” to generate graphics with a single click, significantly streamlining traditional mapping workflows. It also integrates AI-driven intelligence and natural language interaction, allowing for intelligent chart template recommendations, automatic template generation, and parameter configuration. Users can quickly generate required graphics through voice or text commands, making the mapping process smarter and more efficient.

Complete Component Library for E&P Workflows

GeoMapX provides a comprehensive suite of graphic technology components, including planar maps, single-well histograms, engineering tubular diagrams, cross-well profiles, statistical charts, chart plates, development curve graphs, and 3D diagrams. This full range of visualization tools fully supports the graphical needs across the entire workflow in geological research, reservoir engineering, and drilling engineering.

Core Products We Recommend

GeoMapPro - Web-Based Mapping

Generate standard maps instantly online. Simply connect your data to a template and create with one click.

GeoMap - Desktop Precision Mapping

Achieve publication-quality maps. Our desktop suite offers the advanced tools needed for detailed editing and compliance with industrial standards.

GeoMapX - AI-Powered Intelligence

Create and edit maps with words. Describe what you need, and let AI generate and modify complex graphics for you.

Transform Complex Data into Clear, Actionable Insights

Our advanced visualization solution turns your intricate datasets into intuitive, interactive graphics that reveal patterns and drive smarter decisions faster.