Among the mapping products used in oilfield exploration and development, one software product has a name closely associated with the discovery of subsurface resources: GeoMap, the geological mapping solution.
Thirty years ago, when oilfield geologists still worked over enormous paper maps, using pen strokes to delineate the characteristics of subsurface geological structures and reservoirs, a quiet revolution began. The emergence of Jurassic GeoMap, like the first light of dawn, ushered in the transition from manual drafting to computer-aided mapping. This was more than a change of tools; it was a leap in the way people worked and thought. GeoMap freed geologists from labor-intensive, repetitive manual work, enabled data to flow, and made maps computable, laying the first cornerstone of the digital oilfield. At the time, GeoMap became synonymous with modernization and a pioneer in the industry’s advance toward a digital future.
Yet pioneering was only the beginning. Over the decades that followed, GeoMap remained deeply committed to the industry. We understood that genuine strength comes from the utmost respect for professional expertise. GeoMap therefore did not remain merely a mapping tool; it followed a clear path of domain specialization. Industry knowledge, mapping standards, and workflows were systematically embedded in the product’s logic and capabilities. Every incremental refinement was made to depict complex subsurface structures more accurately, and every version upgrade was designed to integrate expert judgment more smoothly. GeoMap thus evolved into a platform that both carries and amplifies industry knowledge and experience. Its strength comes from a deep understanding of, and integration with, the industry.
History advances in spirals. In recent years, we have entered an era shaped by both rapidly expanding data and artificial intelligence. Digital and intelligent oilfields have introduced new requirements for graphical visualization. Faced with both opportunities and challenges, GeoMap once again made a decisive choice: not incremental improvement, but revolutionary reinvention.
GeoMapX was born from this transformation. It is more than an upgrade; it is a new declaration for the next thirty years. GeoMapX retains the essence of GeoMap’s three decades of professional expertise while adding a powerful AI engine. It establishes an intelligent workspace built around one-click chart generation, integrated data and graphics, and dynamic linkage. By using intelligent algorithms to learn from expert experience, GeoMapX transforms workflows from manual drafting into one-click intelligent chart generation and natural-language-driven chart generation, providing geoscience engineers with process-oriented, intelligent, and reliable visualization support.
GeoMapX is a new-generation intelligent graphical visualization platform for oilfield exploration and development. Built on the JuraData data lake platform, it integrates a complete set of mapping technology components and places AI at its core. Features such as one-click chart generation, intelligent linkage, and automated algorithms are designed to transform data rapidly into visual outputs and, ultimately, actionable insights.
In engineering practice, the value of GeoMapX is primarily reflected in the following areas:
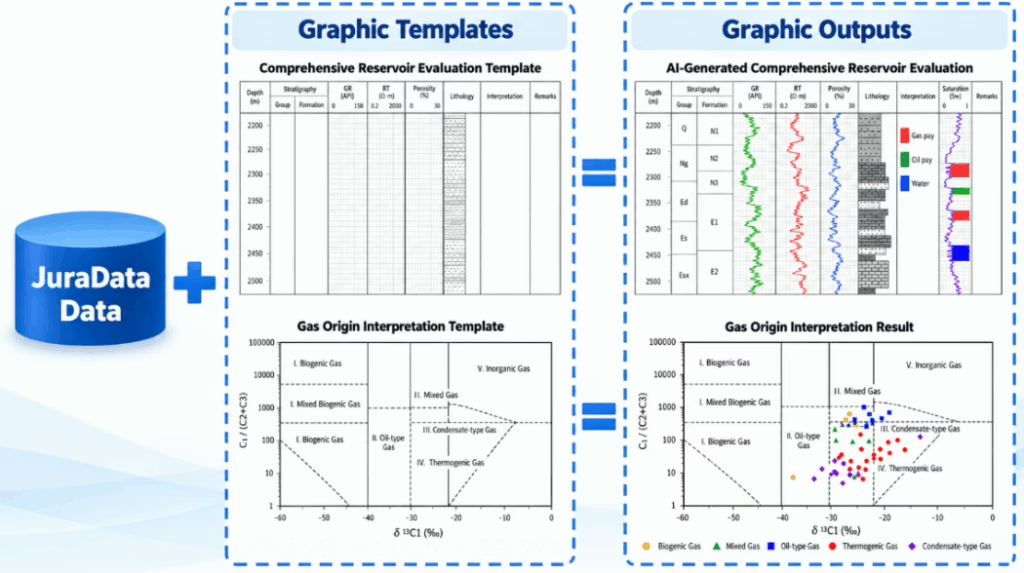
Engineers no longer need to switch among multiple systems to retrieve well-log, production, model, property, and other data. Through deep integration with JuraData, GeoMapX provides single-point access and multi-source synchronization, enabling engineers to obtain the latest and most accurate foundational data directly within the platform.
GeoMapX combines professional chart templates with real-time oilfield data to generate charts with one click, delivering a substantial improvement in efficiency.
With AI as its engine, the platform supports intelligent recommendations, chart-template generation, and automatic configuration of mapping parameters. Through natural-language interaction—for example, “Generate a production curve for Well A covering the past six months”—AI interprets the user’s intent and completes the chart automatically.
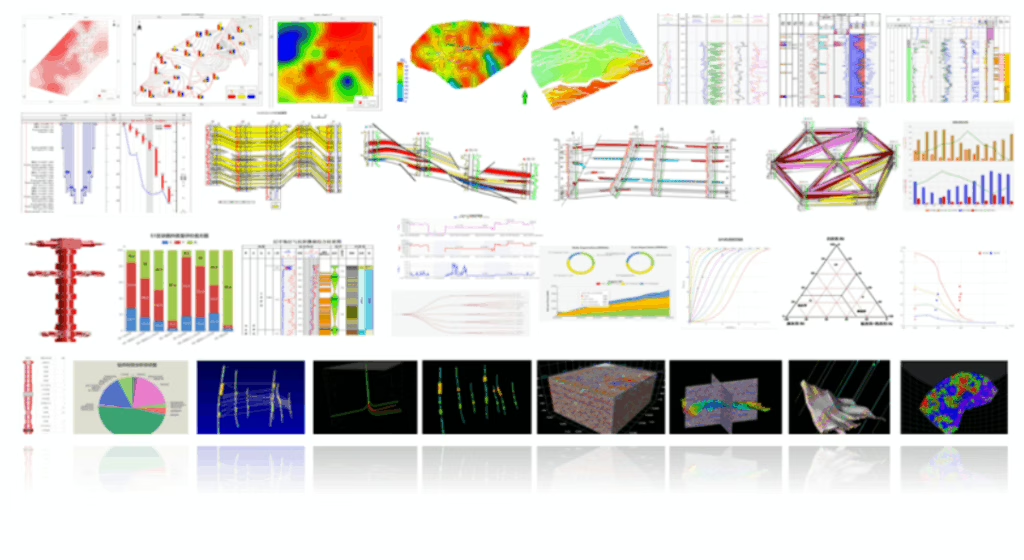
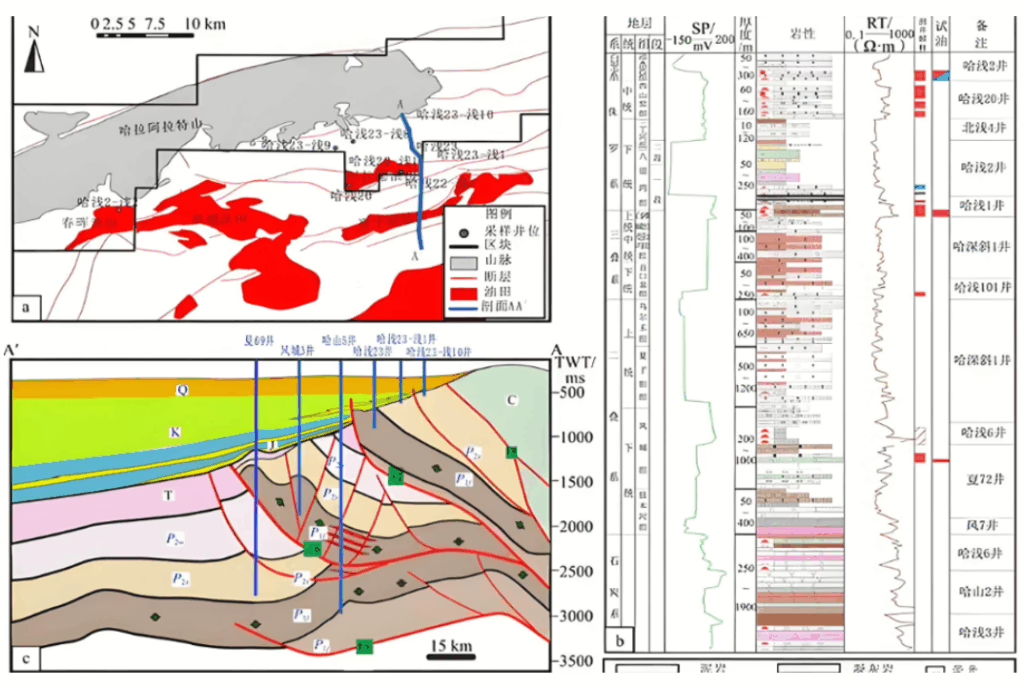
Plan maps, single-well column diagrams, well-to-well cross sections, 3D graphics, tubing-string diagrams, development curves, and crossplots are all provided as standard components. Engineers can call templates directly to generate graphics with consistent styles and formats, eliminating the need to repeatedly configure or adjust the appearance of each individual chart.

Based on a unified data model and an event-driven architecture, we developed an advanced linked graphics-rendering engine and a change data capture (CDC) mechanism. With these technologies at its core, GeoMapX delivers two major capabilities:
GeoMapX is deeply integrated with JuraData. Whenever the underlying data is updated, GeoMapX automatically captures the change through its CDC mechanism and triggers the graphics-rendering engine to update all associated charts in real time. In other words, when the data changes, the graphics change with it. This prevents decision-making risks caused by outdated data products and ensures consistency between graphics and data at the source.
Based on JuraData, any modification made in one graphic is automatically synchronized by GeoMapX across all related graphics, enabling a single change to be propagated to multiple charts. This not only maintains a single data source and ensures that professional interpretations remain consistent across plan maps, column diagrams, cross sections, and other output types, but also frees engineers from cumbersome, repetitive, and error-prone manual cross-checking and modification across multiple graphics.
GeoMapX deeply integrates natural language processing. Engineers no longer need to memorize complex commands or operating procedures. Instead, they can rapidly generate target graphics through efficient interactions such as one-click generation and voice-command generation. In the past, producing a complete structural map or reservoir property map—from data cleansing and format conversion to fault interpretation and final optimization—often required hours or even days and depended heavily on individual experience. Today, natural-language instructions or a single operation allow the system to complete data processing and chart generation automatically within minutes. This not only significantly improves mapping efficiency but also substantially lowers the technical barrier to professional use, allowing domain specialists to focus more closely on geological analysis and decision-making.
While improving efficiency, GeoMapX consistently ensures the professionalism and reliability of its outputs. By deeply integrating domain knowledge from oilfield geology and related disciplines, GeoMapX ensures that every graphic complies with geological principles and mapping standards and is ready for immediate use. Engineers can therefore devote the time they save to higher-value geological interpretation, program optimization, and innovative research, advancing their role from operator to decision-maker and focusing their work on greater value creation.
From the pioneer that launched a revolution, to the platform that carried decades of professional expertise, and now to an innovator embracing intelligence, GeoMap’s three-stage journey has always been driven by the product’s ability to turn the impossible into the possible.
Its strength lies in having initiated the industry’s digital transformation.
Its strength lies in transforming industry expertise into reusable digital assets. Above all, its strength lies in never standing still: remaining at the forefront of technology and providing the sharpest “eyes” and the most intelligent “brain” for oil and gas exploration and development.
Today, we look back not only to honor past achievements, but also to clarify the direction ahead. The GeoMap story began by replacing manual pen strokes, flourished through the steady integration of professional expertise, and is now moving toward an AI-driven intelligent future.
Quick Links
About Us